A quick fix for the VNX

If you are a customer, partner, or EMC employee and you are subscribed to the ETA notifications list, you probably got a heads up about potential incompatibility between the VNX, RecoverPoint, and VAAI under certain conditions.  For those of you who are not subscribed, fellow blogger Cormac Hogan wrote a quick little post about the issue.


I’m proud to announce that there is a fix available for this and it can be found in VNX Block OE 05.32.000.5.206 (released this week).  Simply apply this fix (you can do it yourself using USM).  For those of you with a FILE front end, make sure you update to 7.1.71.1 as well.


If you are an EMC Customer (with support zone credentials), you can read the full description of solution emc327099 (now stored on the new knowledgebase solution powered by Salesforce).  If the direct link is not working, simply login to http://support.emc.com and search for “emc327099” and your first result should be the solution.

VNX INYO MR1–The Future is Now

EMC World 2012 - Day 1 150With a new year, comes a HUGE update to the VNX family.  As Chad Sakac reveled earlier in the year, INYO was the code name for the VNX FILE OE 7.1 and BLOCK OE 05.32 code release that surfaced last year.  Now, the time has come for a major update to the code, and with it some exciting new features.


VNX OE for FILE

On the FILE side, the biggest (and what I think is the most exciting) feature coming is support for SMB 3.0 and the VNX is the first array to support this.  Back in October of 2012, Microsoft released it’s latest versions of the Windows Operating system (Windows 8 and Server 2012).  With that came the latest enhancements to the SMB protocol (for more information, click here to read a great blog post by Microsoft).  With this upgrade (and the use of the SMB 3.0 protocol) you get a much less disruptive failover which includes keeping the open state of a file and file lock.  You will also notice enhanced throughput by being able to take advantage of the Multi Path IO over SMB 3.0 without the need to configure LACP or EtherChannel.


VNX OE for BLOCK

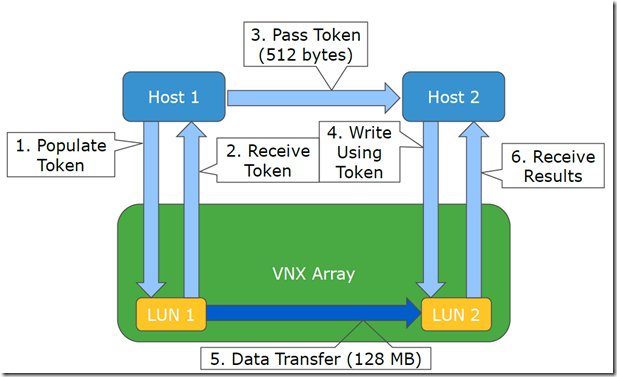
On the BLOCK side, the VNX gains support for ODX support and the ability to Offloaded copies to the array.  This cuts down on host CPU as well as SAN bandwidth as the transfers don’t leave the array.  This is done by breaking down the copy into a series of tokens and passing them between the hosts while the data is passed between luns (as demonstrated in the chart below)

image

A couple of things to note.  This does require an enabler, but you do not need to reboot the SP for that.  You will have to reboot the host for that (it’s a limitation of Microsoft, not EMC).  You will have to use Microsoft MPIO or the latest versions of PowerPath as well as an NTFS file system (with an allocation size of 8k or larger for better performance).


Also included with this release was several enhancements revolving around VAAI support on the VNX.  Most this included the XCOPY fix as described in solution emc313487 as well as a big performance improvement to VAAI Fastclones.  Chad has more on that subject here.


Unisphere Service Manager

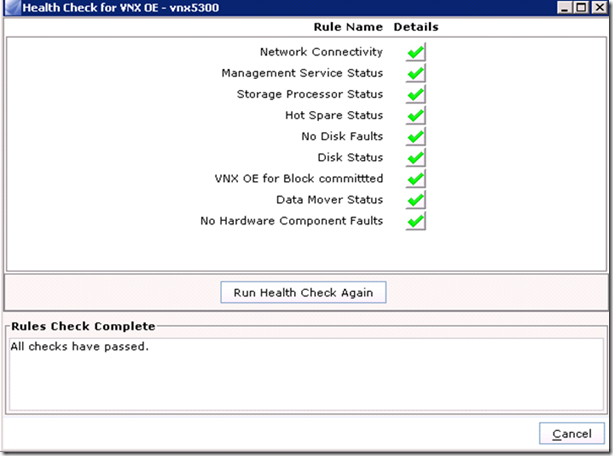
Finally, there was also another enhancement that I wish I had when I was in tech support.  Starting with the new version of Unisphere Service Manager (1.2.26.1.0068) you will now find a 1-click health check available after the main login.  You may remember a previous blog post I did on how to run health checks on the VNX.  Now you can run a single check to verify the health of your array (BLOCK, FILE, or Unified).  Just click the health check link on the right hand side.  I have attached a screen shot below to show what the output of a healthy array looks like.

image

So what are you waiting for?  Get out there and enjoy these new enhancements.  Remember, you don’t have to wait for EMC to upgrade your array, you can do it yourself using USM.

VNX iSCSI and TCP Delayed Acknowledgement

vnx-5500I recently sat in on an internal VNX (and CLARiiON) performance crash course that was put together to help our new hires get up to speed.  Once of the things that stuck out to me was the subject of iSCSI and how it works with host TCP delayed acknowledgement (Delayed ACK).


Background Information

So what is delayed ACK?  As part of TCP, for every packet that is sent to a destination server, that server must send some sort of acknowledgement back to the source server.  This way the source server knows the information was successfully transmitted.  This adds a good amount of overhead, so in an effort to improve performance, TCP Delayed Acknowledgement (RFC 1122) was created which allows a destination server to respond to every 2nd packet instead.  This has become so popular, that support for delayed ACK is enabled by default in many popular client operating systems including Microsoft Windows and VMware ESX/i.


The problem with this is that many storage arrays do not support delayed ACK for one reason or another (usualy has to do with chipset drivers).  What happens in this case is that the array will send a packet, it will then wait for an acknowledgement before sending a 2nd packet.  Meanwhile, the host is waiting for a 2nd packet before sending an acknowledgement.  This standoff between the array and the host will last until the acknowledgement timeout (usually around 200ms) before continuing on.  This wreaks havoc on performance if every packet has to wait 200 milliseconds before sending another.  So if you’ve setup iSCSI and you are immediately seeing a performance issue, check your hosts to see if Delayed ACK is enabled, and turn it off to see if performance improves.


Disabling Delayed ACK in Microsoft Windows


In Microsoft Windows operating systems, you can simply set the TcpAckFrequency registry value to 1.  More information can be found Microsoft kb 328890.  On a side note, I found that if the registry value is missing, you can create it in the path specified in the kb and reboot the host.


Disabling Delayed ACK in VMware ESX and ESXiimage

VMware has created KB 1002598 to address this as well.  This adjustment is made per adapter instance and you can change this setting on a discovery address, a target, or (in my case) globally.  Once you’ve made your change, reboot the host and enjoy the performance boost.


I hope you’ve found this information useful.  It may not solve your iSCSI performance problem, but it is a good place to start.

Lesser known enhancements in the latest VNX code: Simplified Unisphere LDAP Integration

EMC World 2012 - Day 1 150This is part two of my series on lesser known enhancements in the latest code for your VNX.  Today we are going to focus on LDAP.  You may remember my very popular post from last year on configuring LDAP for Unisphere.  One of the big things I stressed before is that even with a Unified system, you still had to configure both the BLOCK & FILE side.  Well, with the latest changes, that is a thing of the past.  Now all the settings are done on the block side, and the new Unisphere Network Service will push them into the control station for you, simplifying the entire process.


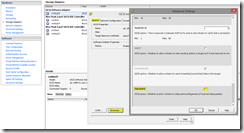
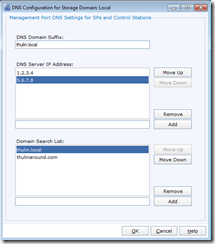
imageLets take a look at the configuration section.  Just like it has been for the BLOCK side, you will find all the settings inside the “Domains” menu.  You will notice right away that there is a new option to configure DNS.  This is crucial for you to configure so that both the SPs and the control station can do host name lookups.


image

  1. DNS Domain Suffix
    • This is where you put in your domain suffix.  This will be your primary domain namespace for lookups.
  2. DNS Server IP Address
    • This is where you specify the IP addresses of your DNS servers.  I recommend using at least 2 here.
  3. Domain Search List
    • If you have multiple domains in your environment, this is where you would list them all in this area in order of search preference.  Make sure your primary domain is at the top of the list.


image

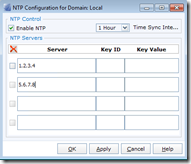
Just as important (in my opinion) as DNS, is configuring NTP.  You can specify up to 4 NTP servers to keep your SP and Control Station times in sync.  This really helps with comparing event logs against other sources.  One thing to note, NTP server Keys support is unique to the SPs.  It will not be copied over to the control station as it does not support it.


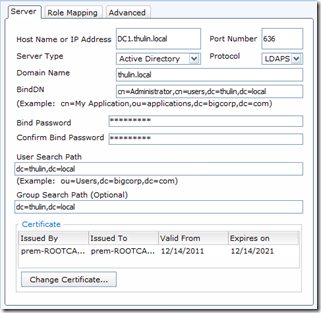
  1. Host Name or IP Addressimage
    • This is where you put in the FQDN or IP of the domain controller.  It is recommended to use the FQDN here, especially if you are using Secure LDAP.
  2. Port
    • 389 for LDAP, 636 for LDAPS
  3. Server Type
    • There are two options: LDAP Server and Active Directory. Make sure to choose “Active Directory” if you’re using an AD environment (most of you will be doing this)
  4. Protocol
    • LDAP or LDAPS
  5. Domain Name
    • Here you will specify the domain name being used
  6. BindDN
    • This is where you put the distinguished name of the service account. For this example I just used the administrator account
  7. Bind Password
    • Password for the service account
  8. Confirm Bind Password
    • Make sure it matches
  9. User Search Path
    • Just like with File, this is where you would set the search scope to find your users
  10. Group Search Path
    • Just like with File, This is where you set the search scope to find your groups
  11. Add certificate
    • This is where you would upload a root CA certificate for LDAPS. Make sure it’s in base64 encoding.  You will need the entire certificate chain, so if you have multiple CAs in your chain, cut and paste them into the “cut and paste” section.   The system will attempt to validate the certificate and let you know if there were problems during validation.  Make sure you have DNS configured if you are going to do this.


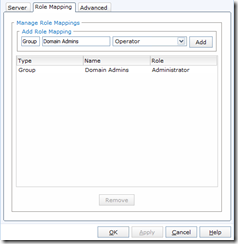
imageAfter you have put in all this information, click on the “Role Mapping” tab so we can map an AD group. In this updated version, individual LDAP user mapping has been removed, so make sure your AD groups contain only the users you want to give access.  Put in the name of the AD group (in this example I used “Domain Admins”), then select the Role from the second pull down (in this case I selected Administrator), and finally click “Add” to add the mapping. Once you have all your mappings, click ok and wait for the confirmation message.  The final addition is the ability to configure the level of nested group support in the advanced tab.  By default, it is set to zero.


Once you have finished all this configuration, you will want to do this all over again for the second domain controller. Once you have this all set, click “Synchronize”. And that is it!


image

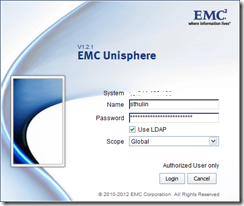
Now it is time to test your LDAP login. Logout of Unisphere by clicking the door icon in the upper right. Open Unisphere again and this time put in your AD username and password. Be sure to select “Use LDAP” and click on “Login”. If all your configuration is correct, you will be brought back in to Unisphere. If you get an access denied message, check you username, password, as well as your user and group search paths.


I hope you find this post useful.  Let me know your own experiences with Unisphere LDAP Integration in the comments below.

Lesser known enhancements in the latest VNX code: Pool luns for FILE

emc%20vnx%205300You may remember my posts on the latest VNX OE code that brought with it some highly publicized enhancements, but I wanted to take this time to speak about some of the lesser known enhancements.  In this post, I’m going to talk about provisioning BLOCK luns for the FILE side.


Historically, from DART 5.x, 6.x, and even VNX OE for FILE 7.0, if you wanted to provision luns to the FILE side, they had to be part of a raid group.  This meant that you couldn’t take advantage of any of the major block enhancements like Tiering and FAST VP.  Well starting with VNX OE for FILE 7.1, you create luns from your pool and provision them to the FILE front end.


For those of you who are not familiar with this process, let me walk you through it.  We’ll start with a pool.  In this example, I created 1 large pool made up of FLASH, SAS, & NL-SAS drives.

image

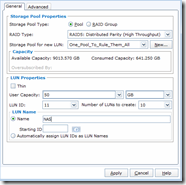
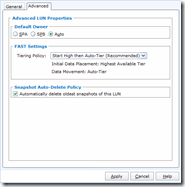
imageimageNow I will create some luns.  When creating luns for FILE, it is best to create them in sets of 10 and provision them as thick luns.  You can always do thin filesystems on the FILE side later.  In this example, I want to make sure to set the default owner to auto so that I get an even number of luns on SPA & SPB.  And of course, to take advantage of the new tiering policy, I have that set to “High then auto-tier”.


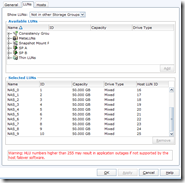
imageWhen this finishes, you’ll get 10 luns split between SPA & SPB and we are ready to assign them to a host.  The storage group for VNX FILE is called “~filestorage”.  Make sure when adding your luns to this storage group, that you start with Host LUN ID of 16 or greater.  If you set it to anything less, it will not be detected on the rescan.  Speaking of rescan, once you have assigned the luns, select the “Rescan Storage Systems” on the right hand side of the Storage section of Unisphere.  Alternatively, you can also run “server_devconfig server_2 –create –scsi –all” to rescan for disks.  You will then need to rerun the command for your other datamovers as well.


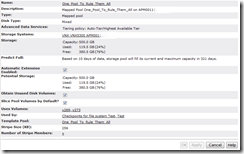
imageNow that we have our new luns scanned into VNX FILE side of things, lets go see what we have.  You will notice that the new FILE pool shares the same name as the BLOCK pool, the drive types are “mixed”, and the tiering policy is specified under advanced services.  That’s pretty much all there is to it.  At this point you would go ahead and provision file systems as normal.


I hope you have enjoyed this look at a new enhancement cooked into the latest VNX code.  Expect more posts on this as I continue the series.  As always, I love to receive feedback, so feel free to leave a comment below.

Introducing EMC’s VNX Storage Analytics Suite (and Early Access Program)

imageWith VMworld in full swing, today EMC finalized the announcement of the new VNX Storage Analytics Suite (and you can try it out on the show floor).  You may remember that this was demoed first at EMC World.  As development was nearing completion, you may remember my call for beta testers (I hope you got in and got a chance to try out the technology).  Now we can start getting as excited as the software will be available for general consumption in Q4 of 2012.


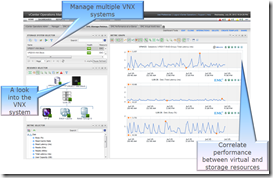
imageThe VNX Storage Analytics Suite will offer you a an extensive platform to proactively identify bottlenecks, balance workloads and pinpoint the root cause of potential problems around health and performance.  The software is available as a stand alone product as well as integration for VMware’s vCOps Enterprise platform.  Pairing the two together allows you to have a full end-to-end visibility of your entire infrastructure from virtual machine to lun and every point in between.


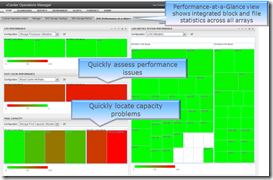
imageFor those of you who are already familiar with vCOps, you will be presented with same interface just with extra options for looking at metrics.  The charts and display is the same.  Green is still good and Red is still bad.  This allows you to quickly visualize the health of your arrays (both block and file) using a simple “Performance-at-a-glance” tab.  Armed with this knowledge, you’ll be able to attach the problem directly instead of waiting for someone to tell you there is a slowdown in the environment.


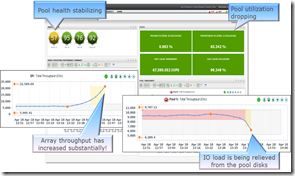
imageBesides general health information, you can dig down into the specifics of utilization on the array.  In the picture to the right, you’ll be able to see the results (both historically and in real time) of enabling fast cache on your array and what it did to the overall health of your environment.  By focusing on the performance of the array and the pool disks, Fast Cache was able to increase the throughput of the SP while decreasing the strain on the spinning disk storage.


By this point you might be saying “Sean, this is so cool, I can’t wait until Q4!  How can I get my hands on this now?”.  Well for those of you who did not participate in the beta (and those of you who did and want to see the results of your feedback) there is good news.   EMC is going to be doing an Early Access program, it won’t cost you a penny, and I’ve got all the details right here!  The bad news is that it’s limited to 100 customers and it’s filling up fast.


If you may remember during the beta program I was asking people to email me if they wanted in.  This time I have no control over the process and you must go through your TC.  Before I tell you just how to get in, I need to make sure you have what is required in your environment.  You will need to meet the following prerequisites:

  • vCenter Operations Manager 5.0.1 Enterprise or higher (vApp distribution)
  • EMC VNX series system (Block: R31 OE version 05.31.000.5.720 and higher and VNX OE R32 version 05.32.000.5.006 and higher; File: VNX OE 7.0.35 and higher).

Seems simple enough, right?  Now on how to get in, as I said before you will need to contact your TC or Account Representative.  Have him or her place a Sales Evaluation order in Direct Express using Model # SASCONN-T90 and complete an RPQ.  Again, this is a no cost evaluation period and if you are selected, you will receive further instructions.  At the end of the preview period (which I believe is somewhere in Q4), you will be given the opportunity to purchase a license or uninstall the software.


If you are attending the show, please let me know your thoughts about the software in the comments section below.

I think my VNX might have gotten sick, how do I give it a health check?

Health_CheckWith cold & flu season fast approaching, it seems that people are worried just as much about their array health as they are about their personal health.  Working in the EMC Unified Storage Remote Support Lab, I see at least 10 new requests each day for a health check on an array and most of the time, there is nothing wrong.  Today I’m going to show you some easy ways to see if there really is a problem or not.  While the VNX array is sold as Block, File, or Unified (a combination of both) the health checks are different for the Block side and the File side.  We’ll start with the File side.


Health Check of VNX FILE

There are two ways of doing a health check on the VNX FILE.  The first method I will demonstrate is the traditional way and is executed via the command line.  This method has been in place since the older celerra models and works the same way on them as well.  To kick off your health check, simply login to the control station using an SSH client and run the command “nas_checkup”.  This process will take several minutes, so go get yourself a coffee and wait until you see something like the output below:

[nasadmin@VNX nasadmin]$ nas_checkup
Check Version:  7.1.47.5
Check Command:  /nas/bin/nas_checkup
Check Log    :  /nas/log/checkup-run.120826-220724.log

————————————-Checks————————————-
Control Station: Checking statistics groups database………………….. Pass
Control Station: Checking if file system usage is under limit………….. Pass
Control Station: Checking if NAS Storage API is installed correctly…….. Pass
Control Station: Checking if NAS Storage APIs match……………………  N/A
Control Station: Checking if NBS clients are started………………….. Pass
Control Station: Checking if NBS configuration exists…………………. Pass
Control Station: Checking if NBS devices are accessible……………….. Pass
Control Station: Checking if NBS service is started…………………… Pass
Control Station: Checking if PXE service is stopped…………………… Pass
Control Station: Checking if standby is up……………………………  N/A
Control Station: Checking integrity of NASDB…………………………. Pass
Control Station: Checking if primary is active……………………….. Pass
Control Station: Checking all callhome files delivered………………… Pass
Control Station: Checking resolv conf……………………………….. Pass
Control Station: Checking if NAS partitions are mounted……………….. Pass
Control Station: Checking ipmi connection……………………………. Pass
Control Station: Checking nas site eventlog configuration……………… Pass
Control Station: Checking nas sys mcd configuration…………………… Pass
Control Station: Checking nas sys eventlog configuration………………. Pass
Control Station: Checking logical volume status………………………. Pass
Control Station: Checking valid nasdb backup files……………………. Pass
Control Station: Checking root disk reserved region…………………… Pass
Control Station: Checking if RDF configuration is valid………………..  N/A
Control Station: Checking if fstab contains duplicate entries………….. Pass
Control Station: Checking if sufficient swap memory available………….. Pass
Control Station: Checking for IP and subnet configuration……………… Pass
Control Station: Checking auto transfer status……………………….. Pass
Control Station: Checking for invalid entries in etc hosts…………….. Pass
Control Station: Checking for correct filesystem mount options…………. Pass
Control Station: Checking the hard drive in the control station………… Pass
Control Station: Checking if Symapi data is present…………………… Pass
Control Station: Checking if Symapi is synced with Storage System………. Pass
Blades         : Checking boot files………………………………… Pass
Blades         : Checking if primary is active……………………….. Pass
Blades         : Checking if root filesystem is too large……………… Pass
Blades         : Checking if root filesystem has enough free space……… Pass
Blades         : Checking network connectivity……………………….. Pass
Blades         : Checking status……………………………………. Pass
Blades         : Checking dart release compatibility………………….. Pass
Blades         : Checking dart version compatibility………………….. Pass
Blades         : Checking server name……………………………….. Pass
Blades         : Checking unique id…………………………………. Pass
Blades         : Checking CIFS file server configuration………………. Pass
Blades         : Checking domain controller connectivity and configuration. Warn
Blades         : Checking DNS connectivity and configuration…………… Pass
Blades         : Checking connectivity to WINS servers………………… Pass
Blades         : Checking I18N mode and unicode translation tables……… Pass
Blades         : Checking connectivity to NTP servers…………………. Warn
Blades         : Checking connectivity to NIS servers…………………. Pass
Blades         : Checking virus checker server configuration…………… Pass
Blades         : Checking if workpart is OK………………………….. Pass
Blades         : Checking if free full dump is available………………. Pass
Blades         : Checking if each primary Blade has standby……………. Pass
Blades         : Checking if Blade parameters use EMC default values……. Info
Blades         : Checking VDM root filesystem space usage………………  N/A
Blades         : Checking if file system usage is under limit………….. Pass
Blades         : Checking slic signature…………………………….. Pass
Storage System : Checking disk emulation type………………………… Pass
Storage System : Checking disk high availability access……………….. Pass
Storage System : Checking disks read cache enabled……………………. Pass
Storage System : Checking disks and storage processors write cache enabled. Pass
Storage System : Checking if FLARE is committed………………………. Pass
Storage System : Checking if FLARE is supported………………………. Pass
Storage System : Checking array model……………………………….. Pass
Storage System : Checking if microcode is supported……………………  N/A
Storage System : Checking no disks or storage processors are failed over… Pass
Storage System : Checking that no disks or storage processors are faulted.. Pass
Storage System : Checking that no hot spares are in use……………….. Pass
Storage System : Checking that no hot spares are rebuilding……………. Pass
Storage System : Checking minimum control lun size……………………. Pass
Storage System : Checking maximum control lun size…………………….  N/A
Storage System : Checking maximum lun address limit…………………… Pass
Storage System : Checking system lun configuration……………………. Pass
Storage System : Checking if storage processors are read cache enabled….. Pass
Storage System : Checking if auto assign are disabled for all luns………  N/A
Storage System : Checking if auto trespass are disabled for all luns…….  N/A
Storage System : Checking storage processor connectivity………………. Pass
Storage System : Checking control lun ownership……………………….  N/A
Storage System : Checking if Fibre Channel zone checker is set up……….  N/A
Storage System : Checking if Fibre Channel zoning is OK………………..  N/A
Storage System : Checking if proxy arp is setup………………………. Pass
Storage System : Checking if Product Serial Number is Correct………….. Pass
Storage System : Checking SPA SPB communication………………………. Pass
Storage System : Checking if secure communications is enabled………….. Pass
Storage System : Checking if backend has mixed disk types……………… Pass
Storage System : Checking for file and block enabler………………….. Pass
Storage System : Checking if nas storage command generates discrepancies… Pass
Storage System : Checking if Repset and CG configuration are consistent…. Pass
Storage System : Checking block operating environment…………………. Pass
Storage System : Checking thin pool usage…………………………….  N/A
Storage System : Checking for domain and federations health on VNX……… Pass
——————————————————————————–

As you can see, just about everything came out as pass or not available (which is fine) except for one or two things.  If you have warnings or errors, you will see a more detailed output below.  I have included an example here:

One or more warnings have occurred. It is recommended that you follow the
instructions provided to correct the problem then try again.

———————————–Information———————————-
Blades : Check if Blade parameters use EMC default values
Information HC_DM_27390050398: The following parameters do not use the
EMC default values:
* Mover_name Facility_name Parameter_name Current_value Default_value
* server_2 cifs acl.extacl 0x00000003 0x00000000
* server_2 cifs acl.useUnixGid 0x00000001 0x00000000
* server_2 cifs djEnforceDhn 0x00000000 0x00000001
* server_2 cifs useUnixGid 0x00000001 0x00000000
* server_2 quota policy ‘filesize’ ‘blocks’
* server_2 shadow followabsolutpath 0x00000001 0x00000000
* server_2 shadow followdotdot 0x00000001 0x00000000
* server_2 tcp fastRTO 0x00000001 0x00000000
* This check is for your information only. It is OK to use parameter
values other than the EMC default values.
* EMC provides guidelines for setting parameter values in the “Celerra
Network Server Parameters Guide” (P/N 300-002-691) that can be found
on
http://powerlink.emc.com/
         * If you need to change the parameter back to the default, run the
following command: “/nas/bin/server_param <mover_name> -facility
<facility_name> -modify <parameter_name> -value <default_value>”
* To display the current value and default value of a parameter, run
the following command: “/nas/bin/server_param <mover_name> -facility
<facility_name> -info <parameter_name>”

——————————————————————————–

————————————Warnings————————————
Blades : Check domain controller connectivity and configuration
Warning HC_DM_18800115743:
* server_2: PingDC failure: The compname ‘cifs01’ could not
successfully contact the DC ‘DC2K8X32’. Failed to access the pipe
NETLOGON at step Open NETLOGON Secure Channel: DC
connected:Access denied
Action : Check domain or Domain Controller access policies. For
NetBIOS servers, ensure that ‘allow pre-Windows 2000 computers to use
this account’ checkbox is selected when joining the server to the
Windows 2000 domain.

Blades : Check connectivity to NTP servers
Warning HC_DM_18800115743:
* server_2: The NTP server ‘1.2.3.4’ is online but does not
respond to any NTP query. As a consequence, the clock of the Data
Mover may be incorrect. This may cause potential failures when CIFS
clients log in. (Kerberos authentication relies on time
synchronization between the servers and the KDCs).
Action : Check the IP address of the NTP server, using the server_date
command. Make sure the NTP service is running on the remote server.

——————————————————————————–

Health checks may trigger the following responses besides Pass or N/A: Info, Warning, & Error.  Info is just informational.  In the example above, it was telling me about all the parameters that have been changed from the default (most likely on purpose too).  Warnings again are not much to worry about either.  They are mostly there to let you know of potential issues or that you might not be following best practice.  These kind of messages indicate that you may have a problem down the road if things get worse, but do not indicate a direct impact at this time.  Finally the most severe is Error.  This means there is a problem and you should address it right away.  All of these come with some basic instructions on how to resolve the problem (or at least where to look) and I would only recommend opening a support ticket if you are getting Errors and cannot solve them on your own.
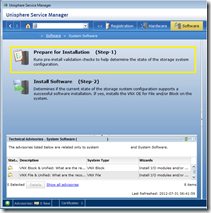
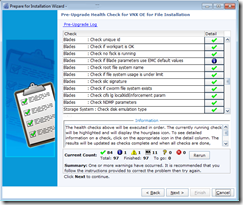
 

imageimageAnother way to run a health check on VNX FILE is through the pre-upgrade wizard.  Start by launching USM and then following the prompts to launch the “Prepare for Installation” task.


Once this has started, it will kick off a health check making sure everything is ok.


Health Check of VNX Block
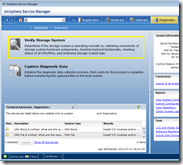
 

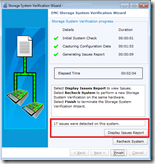
imageimageThis health check is also done is USM and can be found under the “Diagnostic” section.  Simply click on “Verify Storage System” to start doing a back end health report.  Once the wizard starts, it will gather information about the array, and then generate an XML file for you to review.


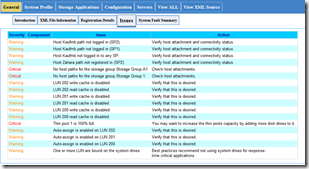
The check will go over events from dating back to the begining of the logs and will display any faults found.  Keep that in mind because if you had a problem several days ago, but don’t right now, it will still tell you that there is a fault.  If issues are found, click “Display Issue Report” to see the XML file and then click on the “Issues” tab in the webpage.
 

image

As you can see from the results, I have some warnings and some critical errors.  Just like I said before, warnings are just make sure you know you that something might be up, but not making an impact yet.  As you can see most of them are because this is a lab box and not all my hosts are logged in, or I’m missing some write cache.  The critical alerts is what you should be concerned about and if you have trouble resolving the issue, open a support ticket to have it inspected.


These are some great ways to see if there really is a problem going on with your system and feel free to let me know if you have any questions about them.

Configuring VASA for use with a VNX

vnxWhen VMware introduced vSphere 5 to the world, one of the enhancements was a new API for storage arrays that provides vSphere with information as to the configuration and performance of your storage array.  For more information on VASA, please see this article from The Virtualization Practice.  VASA on a VNX (and other EMC arrays) historically used to be configured using an SMI-S provider.  This older configuration method has been covered very well by EMC vSpecialist Craig Stewart and can be found here.


Starting with VNX OE for FILE 7.1 and VNX OE for BLOCK 05.32, the VNX now has native VASA support.  This eliminates the need for the SMI-S provider and allows you to point vSphere directly to the control station and SP.  It really is a 1-step implementation and I will show you below.  And there is only 1 caviot to this, and it is VASA for the BLOCK and FILE are done separately.  if you are using, FC, FCoE, or iSCSI connections, you will want to use the BLOCK example, and if you are using NFS, you will want to use the FILE example.


You will want to start in vSphere by going to Home > Administration > Storage Providers.  From there you would click on “add…” to configure your connection.


VNX OE for FILE 7.1 VASA configuration example

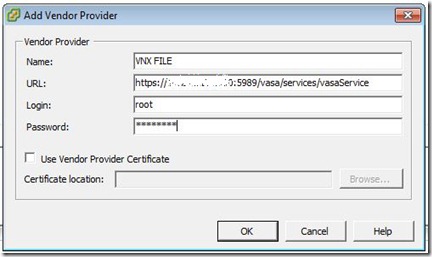
You will start by naming this connection.  I chose VNX FILE to make it easy to distinguish between block and file connections.  You will then use the URL as follows: https://<ip.or.dns.of.control.station>:5989/vasa/services/vasaService.  The username/password would be one local to the control station (such as nasadmin or root).  The global accounts from the storage domain will not work here.  When it’s all said and done you should have something like the photo below:

VASA_VNX_FILE

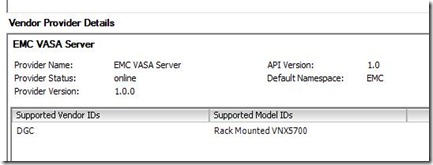
You will probably be prompted to verify the SHA fingerprint, so just click yes and soon you’ll see your new provider listed with the following information:

VASA_VNX_FILE_2


VNX OE for BLOCK 05.32 configuration example

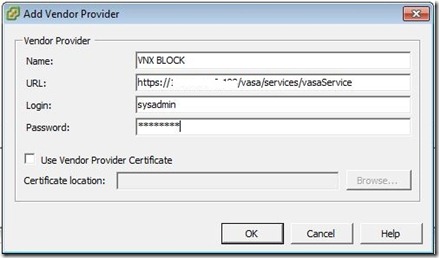
Just like the VNX OE for FILE example, you will start off by using a name.  This time the URL will be pointing to the SP.  The url will be as follows: https://<ip.or.dns.of.SP>/vasa/services/vasaService.  Please note the lack of a port specification as by default https uses port 443.  For the password you will want to use a storage domain account (such as sysadmin).  If you configured it correctly, it should look something like this:

VASA_VNX_BLOCK


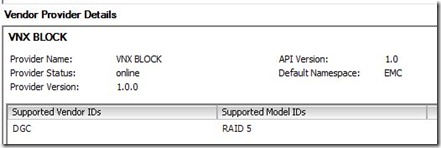
Since I have a very basic configured array in the lab, I see provider information like this:

VASA_VNX_BLOCK_2


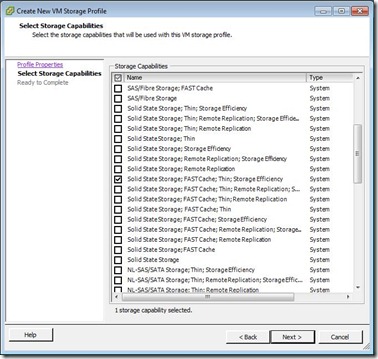
After you have successfully configured your providers, you can go and setup your storage profiles.  Go to Home > Management > VM Storage Profiles and add a new profile.  From there you can select from a multitude of options to pick the one that best matches the lun you are using for storage.

VASA_VNX_STORAGE_PROFILES

It really is that simple!  For more information on VASA on the VNX, read the Virtualization for EMC® VNX Release Notes (EMC Support credentials required).

Got a VNX and vCOps? We need your help!

imageIf you remember during EMC World 2012, the USD team showed off a preview of our new storage analytics package that would come as either a stand alone application or as a plugin for VMware vCOps.  As we move ever closer to a final product, we have entered the private beta phase.  This is where we need your help.


USD Engineering will be running a private beta between August 8th and August 29th and the test plan should take about 2 days to complete.  What you need is the following (UPDATED):


  • A VNX running recent code.  Both File 7.0 & 7.1 and Block 5.31 & 5.32 should be acceptable (this can be production or non production)
  • vCOps running the Enterprise or Enterprise+ (this must be a non production / test instance)
  • The name of your EMC contact (preferably a TC)
  • Please also indicate if you are a customer or a partner

You may need to sign an NDA, I’m not 100% on that but the team running the beta will be able to confirm.  Space is limited and we only have a few slots left so there is no guarantee that you will be accepted into the program.  If you are interested, please send an email to “sean.dot.thulin.at.emc.dot.com” with your contact information and what you have available as equipment (make / model of VNX and software version installed) and I will forward it on to the team.  Act fast as we are almost ready to start!
Introducing VNX FILE OE 7.1 & BLOCK OE 05.32

EMC-VNXIts here! It’s finally here!  Today marks the general availability of the first release in a new line of VNX code.  Many of you may remember my preview posts on what can be found in this latest version (found here and here). Now you can take it for a spin and try out these new features and changes.


As of today, you can browse to the VNX Product Support Page or use the Unisphere Service Manager (USM) tool (which has been upgraded to version 1.2.0.1.0554) to download VNX FILE OE 7.1.47.5 and VNX BLOCK OE 05.32.000.5.006.  Again to highlight some of the changes you will see:

  • New “Flash First” data aging policy for tiering
  • Mixed raid levels for storage pools
  • Enhanced block snapshots
  • Windows Branch Cache support for CIFS
  • Simplified Unisphere LDAP configuration (see my note here)
  • FLR upgrades and enhancements

There are more changes under the hood than I could possibly list here, but a full set of release notes and documentation can be found on the VNX Product Support Page as well as the GA announcement that I posted on ECN.


Well what are you waiting for?  Go out and upgrade (remember that this is an out of family upgrade) and start enjoying the latest and greatest in unified storage and let me know what you think of it in the comments below!